
Options are an excellent way for investors to hedge risk or traders to increase leverage. But understanding the language and mechanics of options trading can feel overwhelming. And, the first confusing thing new options traders will encounter is likely the options chain, which provides vital information about various contracts available for a specific stock.
In this article, we’ll guide you through how to read an options chain and come away with the information you need to make informed decisions.
[Tweet “Options chains are an essential tool for understanding the contracts available for a specific stock or security. Here’s what you need to know about them.”]
What is an Options Chain?
Options chains visually represent the available call and put options for a specific stock or security. In particular, they provide valuable information like strike prices, expiration dates, and premiums. You can find them on most brokerage platforms, as well as on financial news websites or in options analysis software platforms.
Options chains may appear in two formats:
- List – As the name suggests, a list is simply a list of option contracts for a specific expiration date. Typically, these lists have descending strike prices with call options above put options.
- Straddle – A straddle shows calls and puts side-by-side with the strike price in the middle. Many traders prefer straddles because you can compare put versus call activity at each strike price.
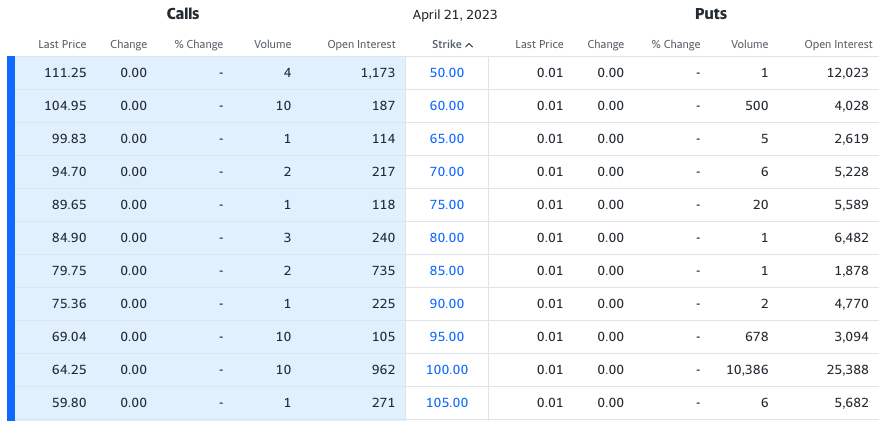
Example of an options chain from Yahoo! Finance for Apple Inc. (AAPL). Source: Yahoo! Finance
Most options chains let you select a strike price and show either a list or a straddle view of the options contracts for that expiration date. In the example above from Yahoo! Finance, you can see a straddle view for options expiring on April 21, 2023.
Note: You can use this same chart throughout this article to reference the dynamics we discuss. For example, we note that contracts near the money have more volume and lower premiums. Also, Implied Volatility only appears on Yahoo if you choose a List view.
Breaking Down the Options Chain
Options chains may contain several pieces of information. While there may be some differences between platforms, you’ll find most of the same information regardless of where you look up options chains. So, let’s discuss some of these elements and how you can use them to analyze an option contract’s risk and reward potential.
Options Chain Ticker Symbol
The ticker symbol for the underlying stock or security is typically at the top of the option chain. Of course, you should double-check that you’re looking at the correct underlying stock to avoid any troubles.
Expiration Date
Options give buyers the right to buy or sell an underlying stock at a specific agreed-upon price before a deadline. This deadline is known as the “expiration date,” and it’s the last day owners can exercise or trade options before they expire.
Generally, short-term expiration dates have lower premiums than long-term expiration dates. That’s because long-term options have more “time value” built up (e.g., there’s more time for the stock price to move higher or lower due to some unforeseen catalyst).
Strike Prices
The strike price is the agreed-upon price at which the option owner can buy (call option) or sell (put option) the underlying stock or security. These strike prices appear in descending order down the options chain, regardless of whether it’s a list or straddle view.
The strike price closest to the current market price is known as the “at-the-money” strike price. Meanwhile, strike prices below the current market price are referred to as “in-the-money,” and those above the current market price are “out-of-the-money” for calls. The opposite is true for puts.
Bid & Ask Prices
Just like stocks, each option contract has a bid and ask price. The bid price is the highest price a buyer is willing to pay for an option contract, while the ask is the lowest price a seller is willing to accept. The difference between the bid and ask is known as the bid-ask spread, which reflects the liquidity and popularity of the option contract.
A narrower bid-ask spread suggests a more liquid (and popular) market. That’s because more participants and trading volumes narrow the spread as buyers are more likely to find sellers and vice-versa. Bid-ask spreads have become very narrow for stock trading, but they still exist and make an impact on option trades. You should be very cautious when trading illiquid options.
Volume & Open Interest
Volume refers to the number of option contracts traded during a specific period, while open interest represents the total number of outstanding option contracts. Option volume may decrease over time, particularly if the stock price moves away from the strike price.
These two metrics can provide insight into a specific option’s liquidity and market activity. For example, higher volume can suggest immediate interest in an option contract, while high open interest indicates a potentially deep market of possible buyers and sellers if the price is right.
Implied Volatility
Implied volatility (IV) measures the market’s expectation of the underlying asset’s future price movement. A higher IV indicates the market anticipates significant price fluctuations, whereas a lower IV suggests a stable stock price expectation.
IV is essential for options traders because it can help assess the likelihood of large price swings. In particular, covered call buyers might want to look at IV to determine their chance of experiencing an assignment and having to deliver their underlying stock.
The Bottom Line
Reading an options chain may seem daunting initially, but with practice and understanding, it becomes an invaluable tool for options traders. By analyzing information on an options chain, you can make more informed decisions about which options to buy or sell, helping maximize your profit potential and effectively manage risk.
If you want to learn more, take our free e-course to discover the ins and outs of covered calls. And dive deeper into the Snider Investment Method to understand other essential facets of options trading, ranging from screening for the best opportunities to managing positions that go awry after you’ve already bought into a stock.