
Bear markets occur when a market index falls more than 20% from recent highs. While it would be great to predict a bear market and sell immediately before it occurs, timing the market is impossible to do consistently. In fact, that’s a huge reason why actively-managed funds tend to underperform passive funds. However, watching bear market indicators can help you tweak your portfolio.
Let’s take a look at some market indicators to predict a bear market and how you can use them.
Market timing is rarely a good idea, but bear market indicators can help you tweak your portfolio.
#1. Yield Curve
The bond market is an excellent predictor of inflation and the economy’s direction. While many investors look at a benchmark 10-year or 30-year bond, yield curves that plot the yields of similar bonds across different maturity dates provide the most predictive power. In particular, the shape of the yield curve can tell you a lot about the market’s sentiment.
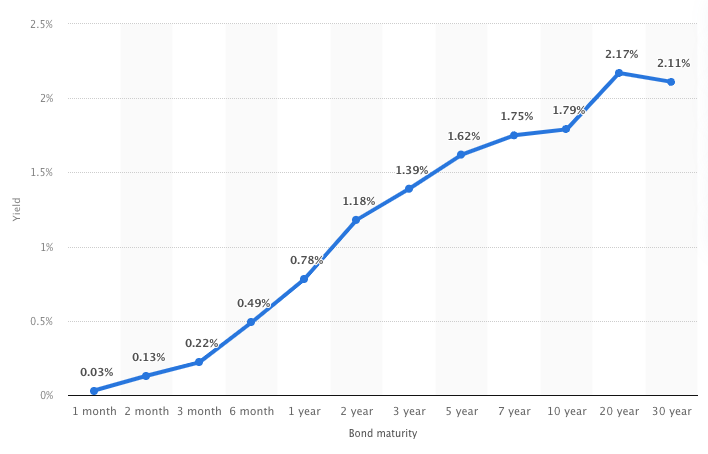
Example of the Treasury yield curve. Source: Statista
There are three types of yield curves:
- Normal yield curves slope upward over time, suggesting the economy is growing at a healthy pace.
- Inverted yield curves slope downward over time, indicating a recession is on the horizon.
- Flat yield curves have very little difference between maturity dates, meaning there’s a lot of uncertainty.
Flat or inverted yield curves mean that a bear market is possible over the coming months or years. For example, an inverted yield curve suggests that bondholders believe long-term interest rates will be lower than short-term interest rates. And, in most cases, interest rates only move lower when the Federal Reserve needs to stimulate the economy.
#2. Credit Spreads
Bond yields are a harbinger that a recession may be coming, but they aren’t the only bond market indicator investors should watch. Credit spreads track the difference in yield between two types of bonds—typically Treasuries and corporate bonds—and paint a clearer picture of how risky or risk-averse investors are at any point in time.
Download our free checklist of option strategies for bear markets.
There are two scenarios to consider:
- Widening credit spreads suggest that investors are dumping corporate bonds and moving into Treasuries—a risk-off trade that could be a harbinger of an economic downturn.
- Tightening credit spreads indicate that investors don’t see much risk in the corporate sector. As a result, it’s frequently a sign of a bull market with positive future expectations.
Widening credit spreads are a clear indicator of a potential bear market. In addition to looking at Treasuries and corporate bonds, some investors look at high-yield bonds (e.g., junk bonds) versus investment-grade corporate bonds. These may provide an earlier warning since high-yield bonds stand to suffer the most during a bear market.
#3. Sector Rotation
Bear markets are typically bad for stocks, but the decline isn’t even throughout the market. For instance, specific sectors outperform during recessionary environments while others outperform in bull markets. For example, growth stocks tend to do poorly during bear markets, whereas value stocks typically perform best during bear markets.
The best performing bear market sectors include
- Consumer Staples
- Utilities
- Health Care
- Telecom
- Energy
Many of these companies offer above-average dividend yields and have business models that don’t rely on discretionary income. For example, everyone has to pay their utility bills regardless of the economic environment. So when these sectors start to rise and high-growth sectors (like tech) begin to fall, it can signify that a bear market is coming.
#4. Valuations
Valuations may seem like an obvious sign that a bear market is around the corner. However, there’s a common adage among investment professionals that “the market can remain irrational longer than you can remain solvent.” In other words, high valuations could become even higher before the market crashes, and they move lower.
Don’t forget to download our free checklist of option strategies for bear markets.
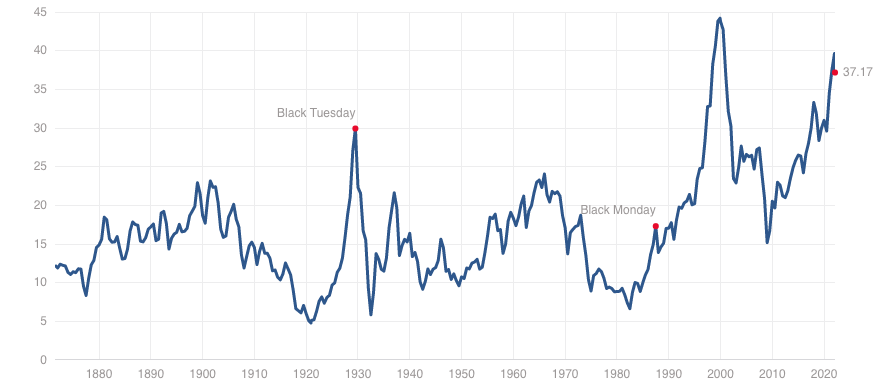
Example of the Shiller P/E ratio. Source: Multpl
That said, valuations still play a role in predicting a bear market when combined with other indicators. You can also analyze the valuation of specific market subsets, such as tech or housing, and identify the parts of the economy that could see the steepest losses during a downturn, helping you hedge your portfolio.
Some valuation indicators to watch include:
- P/E to Growth (PEG) Ratios go beyond a simple price-earnings ratio to factor in growth rates. After all, high-growth companies may be worth the multiple if they continue to grow.
- Shiller P/E Ratios adjust simple price-earnings ratios with inflation, providing a more accurate look at cost. That way, if inflation soars, P/E ratios don’t look overly expensive.
- P/FCF Ratios compare the price to a business’ free cash flow. While not appropriate for all sectors, these ratios can tell you when investors ignore income in their valuations.
#5. Technical Analysis
Technical analysis has a mixed reputation on Wall Street, but it’s simply applying statistics to securities analysis at its core. For example, many technical analysts look for prices that deviate to extremes from their mean (or average) price. When that occurs, they place bets that the price will eventually revert to the mean—a strategy known as mean reversion.
Some bear market technical indicators include:
- Death Crosses occur when the 50-day moving average crosses below the 200-day moving average. The X-shape that it creates tends to suggest an upcoming bear market.
- Head and Shoulders patterns occur when a market reaches a new high, followed by another high, but fails to surpass the high on a third attempt, suggesting slowing momentum.
Technical analysis works best when combined with other bear market indicators, including the four others on our list. In fact, technical analysts have a term for technical head fakes: “bear traps.” Bear traps occur when a technical indicator suggests that there will be a downturn, but the market rallies instead, and trades lose out. We don’t recommend basing your entire investment thesis on technical analysis, but it doesn’t hurt to consider the current trend when looking at other factors.
The Bottom Line
There are many indicators that claim to predict an upcoming bear market or recession, but timing the market is notoriously tricky. Unfortunately, nothing is 100% foolproof. While these indicators suggest that the market is irrational, history has shown that irrational behavior can last months or years before the day of reckoning. As a result, most investors are best off with a systematic, rules-based strategy.
That said, it might make sense for investors to shift their portfolios based on irrational market behaviors. For example, investors may want to transition into value stocks with more reasonable valuations if earnings multiples are irrationally high. Investors may also need to adapt to changes in interest rates, dividends, and bond yields.